Angular DevTools icon

Angular DevTools Chrome Extension Analysis

Developer & Designer Tools

Chrome extension ID: ienfalfjdbdpebioblfackkekamfmbnh

A developer tool designed to help engineers inspect and optimize Angular applications. It offers specialized tabs for profiling execution time and visualizing the framework's internal state.

Developer:Angular
Version:1.16.0
Size:821KiB
Last updated:

Overview

Installs

400K+

Rating

3.7

189 reviews

Languages

1 locales

Includes English (United States)

Market analysis

Review-backed positioning, friction, and market signals for this Chrome extension.

Backed by review samples

Macro category

Developer & Designer Tools

Pricing friction

Low review signal

Complaint intensity

Moderate review signal

Listing & review signals
Observed signals from store listing text and review samples.

Listing positioning

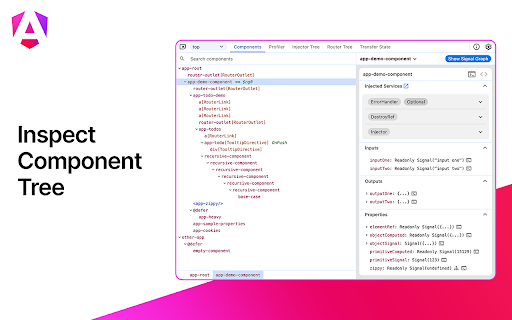
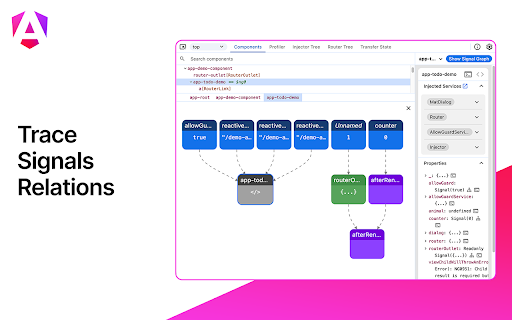
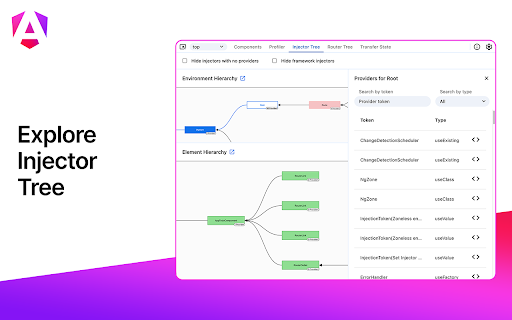
Positions itself as an extension for Chrome DevTools that provides Angular-specific debugging and profiling. It emphasizes visibility into application structure, component state, change detection cycles, and dependency injection trees.

Inferred product pattern

Official first-party framework utility for developer productivity.

Review-backed pain points

Users report significant issues with the extension failing to detect Angular apps even when running in development mode. There are also reports of the tool causing performance lag in the applications it is debugging and experiencing internal JavaScript errors.

Observed feature gaps

Unreliable environment detection and unstable variable inspection UI.

Tags
Angular DebuggerWeb DevelopmentPerformance ProfilerFrontend Tools
Target users

- Angular Developers

- Frontend Engineers

- Web Performance Specialists

Primary use cases

- Debugging component and directive state

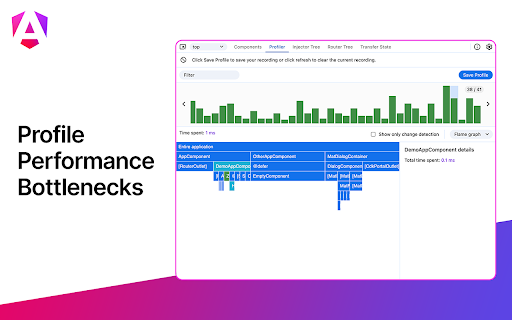
- Profiling change detection cycles to optimize performance

- Inspecting dependency injection trees

Positive themes

No positive theme data.

Negative themes

- Failure to detect Angular applications

- Incorrect production mode detection

- Application performance degradation

- UI crashes and TypeErrors

Observed friction

- Performance complaints detected

- No pricing friction observed as the tool is provided for free.

Evidence boundary: Data extracted from the official store listing and a sample of 10 helpful/low-rating reviews. Positive review themes are unavailable as provided review samples only contained low-rating feedback.
Complaint summaries
Review-backed complaint signals grouped by operational area.

Support

No direct support interaction complaints, though users expressed frustration over persistent bugs.

Reliability

High reliability issues including frequent failures to recognize Angular apps and crashes during inspection.

Privacy

One user expressed confusion and slight suspicion regarding the extension's ownership/origin.

Access & pricing

- Free usage observed

- No account requirement observed

- Free plan or free usage claimed

Store listing facts

Listing assets

- Screenshots: 5

- Videos: 0

- Languages: 1

Trust signals

- Privacy policy

- Developer contact

- Support link

Store metadata

- Version: 1.16.0

- Size: 821KiB

- Last updated:

Store description excerpt
Short excerpt from the public Chrome Web Store listing; full copy is available on the official store page.
You can use Angular DevTools to understand the structure of your application and preview the state of the directive and the component instances. To get insights into the execution of the application, you can use the profiler tab, which shows you the individual change detection cycles, what triggered them, and how much time Angular spent in them. You can also inspect and visualize your application's dependency injection tree to better how understand how and why any token was resolved to a specific service.

Listing SEO keywords

Search intent keywords
Keyword signals for evaluating how users may discover, compare, or search for this extension category.

Core discovery

Angular DevToolsAngular debuggerAngular profiling toolChrome extension for Angular

Comparison

Angular DevTools vs ng.getComponentbest Angular debugging extensions

Problem

Angular app not detectedAngular DevTools production mode errordebug Angular change detection

Alternative

Angular debugging alternativesAngular CLI debugging tools

Similar extensions

Jump to related discovery paths:

FAQ

What is Angular DevTools mainly used for?
A developer tool designed to help engineers inspect and optimize Angular applications. It offers specialized tabs for profiling execution time and visualizing the framework's internal state.
What market signals stand out?
Established adoption with moderate review base. Last known update: 06/10/2026.
What should builders compare before entering this space?
Compare install concentration, rating quality, update recency, screenshots, developer portfolio, listing claims, and review-backed friction signals.
Is this page review-backed?
Backed by review samples. This page combines store metadata with selected review signals, while raw store metrics remain visible for comparison.

Screenshots

Angular DevTools screenshot

Links

Recommended Chrome extensions

Related listings from the same category, trending peers, and the same publisher portfolio.

Browse developer