
Google Analytics Debugger Chrome Extension Analysis
SEO & Traffic AnalyticsChrome extension ID: jnkmfdileelhofjcijamephohjechhna
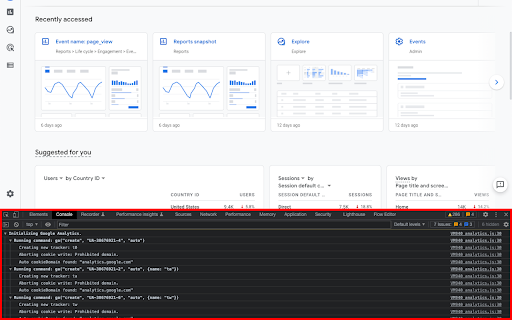
This tool injects a debug version of the Google Analytics JavaScript library into webpages to allow for granular tracking verification. It provides developers with a clear view of tracking beacons and error logs within the Chrome JavaScript console to ensure data collection is configured correctly.
Overview
Installs
600K+
Rating
★ 4.2
536 reviews
Languages
1 locales
Includes English
Market analysis
Review-backed positioning, friction, and market signals for this Chrome extension.
Macro category
SEO & Traffic Analytics
Pricing friction
Low review signal
Complaint intensity
Moderate review signal
Listing positioning
The extension is positioned as an official utility for developers to audit and troubleshoot Google Analytics implementation. It functions by enabling debug versions of analytics scripts and surfacing data directly in the browser console.
Inferred product pattern
Legacy developer utility experiencing severe maintenance decay.
Review-backed pain points
Users frequently report that the tool is unreliable, often failing to detect tracking hits, crashing pages, or requiring multiple page reloads to initialize.
Observed feature gaps
The tool lacks consistent support for modern GA4 features, suffers from perceived abandonment, and fails to handle complex tracking environments.
- Web Developers
- Data Analysts
- Digital Marketers
- QA Engineers
- Verifying GA tracking beacon payloads
- Troubleshooting analytics implementation errors
- Debugging event tracking configurations
- Clean display of tracking hits
- Useful diagnostic data when functional
- Preferred over other debugging plugins
- Sporadic failure to load data
- Lack of maintenance/updates
- Incompatibility with newer GA4 standards
- Requirement for repeated page refreshes
- Performance complaints detected
- None; the product is free.
Support
Users express frustration regarding the lack of active maintenance and documentation from Google despite the extension's critical role for developers.
Reliability
High; users consistently report that the extension requires multiple refreshes, fails to capture hits reliably, and occasionally causes page crashes.
Privacy
No privacy-related complaints found.
- Free usage observed
- No account requirement observed
- Free plan or free usage claimed
Store listing facts
- Screenshots: 2
- Videos: 0
- Languages: 1
- Privacy policy
- Developer contact
- Official website
- Support link
- Version: 3.0
- Size: 28.41KiB
- Last updated:
Listing SEO keywords
Core discovery
Comparison
Problem
Alternative
Similar extensions
Jump to related discovery paths:
FAQ
Screenshots
Links
Website: google.com
Privacy policy: https://policies.google.com/privacy?hl=en-US
Support links: http://www.google.com/support/forum/p/Google+Analytics