
Salesforce Log Inspector Chrome Extension Analysis
Developer & Designer ToolsChrome extension ID: jebmhhcaiafpcjneboknfkmijegiihoe
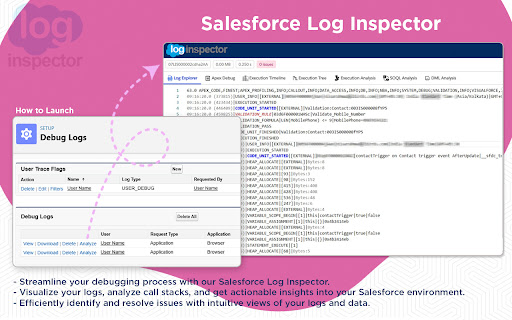
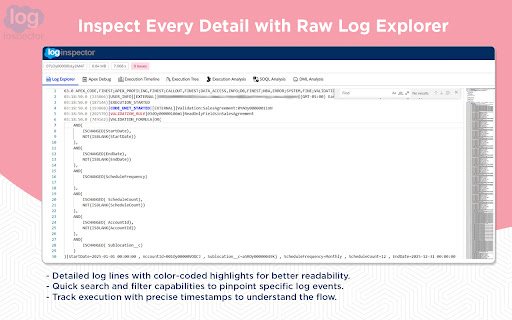
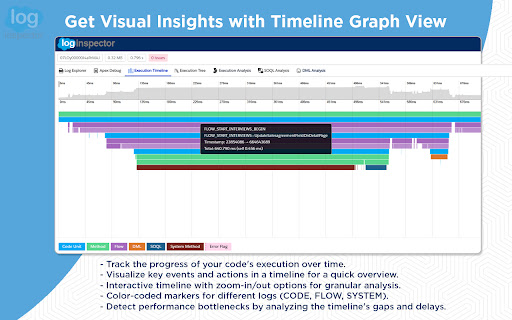
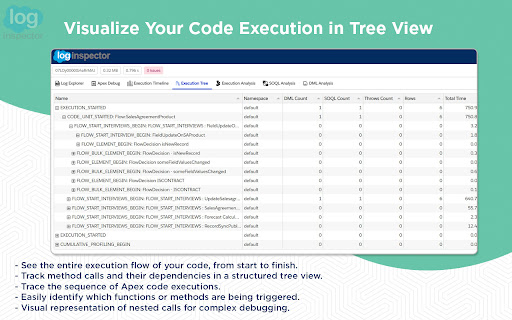
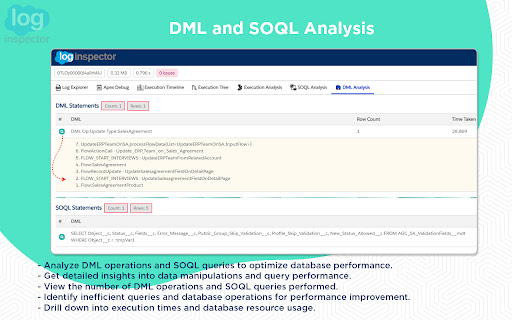
A browser extension for Salesforce developers that provides advanced inspection and analysis of debug logs. It features execution timelines, structured tree views, and specific analysis modules for SOQL, DML, and Flow execution.
Overview
Installs
9K+
Rating
★ 4.8
17 reviews
Languages
1 locales
Includes English
Market analysis
Review-backed positioning, friction, and market signals for this Chrome extension.
Macro category
Developer & Designer Tools
Pricing friction
Low review signal
Complaint intensity
Low review signal
Listing positioning
The product is positioned as a tool to simplify the debugging process and enhance Salesforce performance. It emphasizes transforming raw, unformatted Apex logs into structured, visual data to help developers identify bottlenecks.
Inferred product pattern
Local-first developer utility for log parsing and visualization.
Review-backed pain points
One user reported being unable to use the tool without further detail. Another user suggested that log details should be visible directly within the execution tree to avoid switching views.
Observed feature gaps
Integration of log details directly into the execution tree; verified stability/performance for exceptionally large log files.
- Salesforce Developers
- Salesforce Administrators
- Apex Programmers
- Analyzing Apex debug logs
- Identifying performance bottlenecks
- Monitoring SOQL and DML query counts
- Visualizing code execution flow
- Faster troubleshooting compared to manual parsing
- High utility of the execution timeline and visualization
- Effective identification of root causes and bottlenecks
- Helpful color formatting for variables and debugs
- General usability issues for some users
- Uncertainty regarding performance with very large log files
- No pricing information mentioned in listing or reviews.
Support
No specific support or account-related complaints observed.
Reliability
One user reported an inability to use the extension, but no widespread reliability issues were noted.
Privacy
No privacy complaints; listing explicitly claims local-only data processing with no external server communication.
- Free usage observed
- No account requirement observed
- Free plan or free usage claimed
Store listing facts
- Screenshots: 5
- Videos: 0
- Languages: 1
- Privacy policy
- Developer contact
- Official website
- Version: 1.0.8
- Size: 3.59MiB
- Last updated:
Listing SEO keywords
Core discovery
Comparison
Problem
Alternative
Similar extensions
Jump to related discovery paths:
FAQ
Screenshots
Links
Website: nisar-99.github.io
Privacy policy: https://nisar-99.github.io/salesforce-log-inspector/